
Monitoring Projects: 2001 — 2020
2017- 2020 ECCSCM Water Monitoring Projects
2016 ECCSCM Water Monitoring Projects
2015 ECCSCM Water Monitoring Project
2014 ECCSCM Water Monitoring Projects
2013 Water Monitoring Projects
2011 Water Monitoring Projects
2006 Dissolved Oxygen Monitoring
Summer 2004 Mussel Survey
2001 – 2003 Water Monitoring Project
2004 Air Monitoring
River Raisin and Bean/Tiffin HAB Report 2018-2020
August 14, 2020
Environmentally Concerned Citizens of South Central Michigan Cyanobacteria/cyanotoxin,
Source Species DNA Data, 2017-2020, attached and at link.
PROJECT NOTES and SUMMARY
Estimated Cost, 2017-2020: $23,871, funded by generous contributions from donors and members. Does not include transportation costs, collection and transport equipment (grabber poles, buckets, sample bottles, etc.) or consumables such as distilled water, isopropyl alcohol, gloves and other personal protective gear, hand sanitizer, trash receptacles. Those are all provided by volunteers, who receive no reimbursement or other compensation.
ECCSCM conducts two different types of water monitoring, among 50 different sites in 21 townships, within a 24 x 24 mile (roughly 576 square miles) test bed that stretches from eastern Hillsdale County to mid-Lenawee County and from the Jackson/Hillsdale/Lenawee county lines at the north to the Ohio state line at the south. One is traditional stream study sampling, where sites are sampled to see what is happening at that particular location at that particular time. The other is edge-of-tile-pipe, edge-of-field sampling or upstream/downstream sampling that is done to identify sources and amounts coming from a specific manure application field, and this is done to identify possible violations of the Clean Water Act under the NPDES CAFO permit or violations of other State and Federal statutes.
Our testing area includes 13 of the 14 Michigan NPDES-permitted large CAFOs in the Western Lake Erie watershed, two pig CAFOs and 11 dairy/heifer CAFOs. In 2015, these farms produced roughly 16% of the manure from large, permitted CAFOs in the Western Lake Erie watershed, which includes northwest Ohio and northeast Indiana. As the included map shows, our testing region is split almost down the middle between the Raisin and Bean Creek (Tiffin/Maumee in Ohio) watersheds. In 2017, the permitted CAFOs we monitor held 25,754 cattle and 10,300 pigs for a total of 36,054 confined animals. These cattle and pigs produced 88,269 tons of solid manure and 205,381,107 gallons of liquid manure.
 |
 |
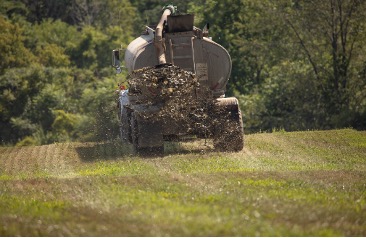
Bean Creek (Tiffin/Maumee) watershed. Left – Tanker fan-casting manure on September 7, 2019. Right – Lineup of manure tankers waiting to apply on a field, September 14, 2019. No crop growing in either field.
 |
 |
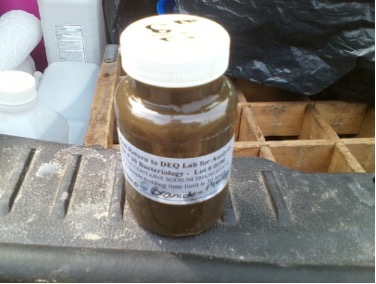
Raisin watershed. Left, sample from documented manure discharge from drain tile to E. coli TMDL stream. E. coli 100,100/100 mL. August 15, 2018. Right, liquid manure dragline application, May 17, 2017.
This particular project was a stream study that took place from 2017 through 2020. Unlike some of our other test sites, it is not possible from the data set attached to identify individual source farms at all of these sites. Our goal was to do an annual check of E. coli and nutrient levels within known CAFO-livestock-housed areas, to see if Cyanobacteria and/or cyanotoxins were present in Michigan’s tributaries to the Raisin River and Bean Creek/Tiffin River within our monitoring area, and to identify DNA from livestock and human sources, as extracted from Bacteroides. Excessive E. coli in surface water has been a long-term problem here, and often attributed almost entirely to stormwater overflows from rural wastewater treatment systems and to faulty or illicit residential septic systems. This is a widespread problem, not just here but all over Michigan. Traditionally we see low levels of E. coli throughout the year, with spikes at certain times. We wanted to see if DNA from the two predominant confined livestock species found here is in the small tributaries that feed the Raisin River and Bean Creek. While DNA from wildlife (including aquatic life) is to be expected, there should never be any domesticated livestock or human DNA in our surface water streams. Another question we had was whether we (and possibly other CAFO-intense watersheds) are seeding Lake Erie with ready-made Cyanobacteria and algal toxins. We began this project after two years (2015 and 2016) of local citizen reports to us about newly-occurring, major algae blooms in small and large inland lakes in the area and based on work with Wayne State and Oakland Universities.
The results attached should be considered a snapshot of conditions at certain locations over the years, with parameters added at each site as our resources became available over time, rather than a scientific study. It is simply an extraction of results from our database, which is continually growing and evolving as technology and resources improve. This information could be the catalyst for further study and for investigating new variables that have not yet been included in current models and forecasts.
This is a separate project from our normal monitoring, which does not include Cyanobacteria and algal toxins or source species DNA. Our normal monitoring for both stream studies and specific incident responses at other sites, which includes E. coli, dissolved oxygen, temperature, nitrates and nitrites, orthophosphate, and ammonia, continues.In the future, we plan to continue our targeted DNA analysis. July is not the month where we see the highest nutrient or E. coli levels – that happens later in the fall after harvest and when manure is applied before winter, when the lagoons are emptied before winter storage. However, July is the month when harmful algae blooms generally begin to be visible both upstream in lakes here and downstream in Lake Erie. This is simply an attempt to compare what was happening here with harmful algae blooms at the same time they generally first became visible in Lake Erie. We hope to add a complete DNA round in the fall to get a more accurate picture of peak loads here. We also are in the process of working with Helix Biological Lab to see if the toxic Microcystis strains found in selected Michigan tributaries are the same ones identified in the paper, Phylogenies of microcystin-producing cyanobacteria in the lower Laurentian Great Lakes suggest extensive genetic connectivity, (Davis, Watson, Rozmarynowycz, Ciborowski, McKay, Bullerjahn), September, 2014
Sites chosen were based on their potential impact from CAFO waste, located immediately downstream from or adjacent to the farms themselves or their nearby manure application fields. Michigan NPDES CAFO-permitted farms either located in, or applying manure, in this project area include Hudson and Medina Dairies, Camden Dairy (currently empty), Bleich Dairy, SunRyze (formerly Legend) Dairy, Hoffland Dairy, Hartland Farms Dairy, Bakerlads Dairy, New Flevo Dairy, Halliwill Farms, and Terrehaven Farms, which are all NPDES-permitted dairy/heifer CAFOs, and William White and State Line Farms, both NPDES-permitted hog CAFOs. Also included is Warner Dairy, which has the minimum number of dairy cattle to be classified as a large CAFO and thus require a Michigan NPDES CAFO permit and which has also been cited for pollution issues. However, the State of Michigan has not required Warner to obtain a permit. Related facilities, such as satellite barns and CAFO feeder facilities are also located in this area. One or more MAEAP best management practices are used at the majority of the manure application fields, in addition to the setbacks and other conservation practices required in the Michigan NPDES CAFO permit. Six of these farms (Bakerlads, Bleich, Hartland, Hudson, Medina, and State Line) were listed on the Michigan Dept. of Agriculture’s January 31, 2020 list of MAEAP-verified farms for livestock and at least one other category, although some of those verifications had expired.
Method – See linked QAP:Raisin Bean Cyanobacteria Stream Study QAP 2017-2020
2017 – Tested for E. coli, nitrates/nitrites, orthophosphate, ammonia, Cyanobacteria (generic), microcystin only, cattle DNA only. Hach test strips used for nutrients.
2018 – Tested for E. coli, nitrates/nitrites, orthophosphate, ammonia, Cyanobacteria – Microcystis, Cyanobacteria – Planktothrix, Cyanobacteria – Other, microcystin only, cattle and swine DNA only. (Only sites in the vicinity where pig manure is applied were analyzed for swine DNA.) Hach test strips used for nutrients.
2019 – Tested for temperature, dissolved oxygen, E. coli, nitrates/nitrites, orthophosphate, ammonia, Cyanobacteria – Microcystis, Cyanobacteria – Planktothrix, Cyanobacteria – Anabaena, microcystin, anatoxin, cattle DNA, swine DNA, human DNA. Hach test strips used for nutrients.
2020 – Tested for E. coli, nitrates/nitrites, orthophosphate, ammonia, Cyanobacteria – Microcystis, Cyanobacteria – Planktothrix, Cyanobacteria – Anabaena, microcystin, anatoxin, cattle DNA, swine DNA, human DNA. eXact iDip 570 nm photometer used for nutrients.
DNA (samples positive/samples tested for that parameter):
DNA Bacteroides – Cattle = 81%
DNA Bacteroides – Swine = 40%
DNA Bacteroides – Human = 93%
DNA Cyanobacteria Unidentified (2017) or Other than Tested (2018) = 64%
DNA Cyanobacteria – Microcystis = 50%
DNA Cyanobacteria – Planktothrix = 50%
DNA Cyanobacteria – Anabaena = 36%
DNA microcystin = 78%
DNA anatoxin = 100%
Many samples had more than one genus of Cyanobacteria and more than one toxin. The USGS table below shows some Cyanobacteria genera and the toxins they produce. (Source: Graham, Loftin, Ziegler, Meyer, Techniques of Water-Resources Investigations 09-A7.5 “Cyanobacteria in Lakes and Reservoirs: Toxin and Taste-Odor Sampling Guidelines”, USGS, Ch. A1, 7.5, 2008)

E.coli – (samples positive/samples tested):
Many sites tested (noted on the datasheet) are located in E. coli TMDL reaches. These TMDLs are in effect from May 1 to Oct. 31 for total body contact recreation and for partial body contact recreation year-round, as follows:
Michigan NREPA, Part 4, Water Quality Standards:
R 323.1062 Microorganisms. Rule 62. (1) All waters of the state protected for total body contact recreation shall not contain more than 130 E. coli per 100 milliliters (mL), as a 30-day geometric mean. Compliance shall be based on the geometric mean of all individual samples taken during five or more sampling events representatively spread over a 30-day period. Each sampling event shall consist of three or more samples taken at representative locations within a defined sampling area. At no time shall the waters of the state protected for total body contact recreation contain more than a maximum of 300 E. coli per 100 mL. Compliance shall be based on the geometric mean of three or more samples taken during the same sampling event at representative locations within a defined sampling area.
(2) All surface waters of the state protected from partial body contact recreation shall not contain more than a maximum of 1,000 E. coli per 100 milliliters. Compliance shall be based on the geometric mean of 3 or more samples, taken during the same sampling event, at representative locations within a defined sampling area.Exceeds E. coli TMDL for that stream >300 mg/mL = 78%
All sites tested, >300 mg/mL = 85%
Nutrients –
For the years 2017-2019, ECCSCM used Hach test strips for nutrients. Test strips are imprecise, especially for orthophosphate where any color change indicates an excessive amount. In order to get more accurate numeric readings, ECCSCM purchased handheld photometers and used them in 2020. The drawback of these portable devices is that, for orthophosphate, they only read results > .02 ppm, and eutrophication starts to occur at >.005 ppm. Because we didn’t use the same equipment all four years, we suggest looking at the data table instead of comparing percentages. In general, among all of our tests and sites, orthophosphate levels start to increase in the late summer at harvest and are at the highest in mid-late fall when manure lagoons are being emptied for the winter.
Temperature/Dissolved Oxygen –
Equipment malfunctions occurred. (We need a new meter.)
This is a working document only, a summary of data including Cyanobacteria, cyanotoxins, and source species DNA from Bacteroides in our database that we’ve collected to date. If you have questions about any of the sites themselves, site conditions, or any of the reported information, please contact me.
Pam Taylor
Environmentally Concerned Citizens of South Central Michigan
Attachments:
2017-2020 cumulative results.pdf
To view the location of the test sites and CAFOs, download this file:
HAB tests 2017-2020 electronic.kmz file.
If you are using Google Chrome or Microsoft Edge, you may need to click and “copy link address”. Then open another tab and paste it in the link. It should download just fine. It appears Chrome is blocking some inline links. Safari and Firefox will download just fine.
When you open the kml file, it will open a Google Earth map of the sites.
Download instructions for Google Earth (web, mobile, & desktop).
Below is snapshot of Test sites – Use Google earth for precise locations.

Michigan Raisin/Bean map with CAFO locations: MI CAFO annotated snip WLEB from Follow the Manure (2017_05_24 16_48_37 UTC) .jpg
Raisin Bean Cyanobacteria Stream Study QAP 2017-2020.pdf
2016 ECCSCM Water Monitoring Projects:
7/18/2016: 2nd Round of water sampling by ECCSCM volunteers
ECCSCM’s monitoring project results for this year, so far. Results in bold are above (or in the case of dissolved oxygen, below) either Michigan’s water quality standards, or EPA-recommended maximum levels.
E. coli samples are collected as grab samples, and are delivered on ice to the MDEQ drinking water lab in Lansing for analysis (Counts 10 – 1,000,000) within 6 hours after collection. Hach test strips are used to test for nutrients, and a YSI DO meter, calibrated before each use, is used to record dissolved oxygen levels and water temperature.
All sites tested had E. coli levels far higher than the maximum E. coli count for total body contact of 130/100mL.
Two sites tested are within the boundaries of an E. coli TMDL. Site No. 42, Deline Drain, lies within the South Branch, Raisin, TMDL dated May, 2008 (attached, with map), which includes a limit of 130/100mL as a 30-day geometric mean and 300/100mL as a daily maximum from May to October, had an E. coli count of 16,000/100mL on July 18, 2016. This particular location is also the site of a MDEQ violation for an unpermitted discharge of manure on 4.28.16 (MDEQ violation letter dated June 13, 2016). Sites No. 9, Lime Lake Inlet on Lime Lake Rd., had an E. coli count of 1,700/100mL on July 18, 2016, and No. 47, Lime Lake Inlet on Elm Rd., had an E. coli count of 1,500/100mL on July 18, 2016. This site is located in the Lime Creek (Prattville Drain and Lime Lake) E. coli TMDL dated January, 2003 (attached, with map). This TMDL limits E. coli to 130/100mL as a 30-day geometric mean from May to October.
Site No. 30, the stormwater drain, tributary to Fisher Lake, continues to be of great concern. On 7.18.16, ECCSCM found E. coli at 11,000/100mL. Of special note is the 1.79 mg/L dissolved oxygen level, exceptionally low for this time of year, which was found at this location, on 4.20.16 and was immediately reported to MDEQ. Low DO continues to be a problem here, and on 7.18.16 it was 2.86 mg/L. ECCSCM received a report last month of possible cyanobacteria on Fisher Lake itself, and we immediately reported this to MDEQ as directed for follow-up.
Dissolved oxygen levels were also below the Michigan water quality standard of 5.0 mg/L at several additional sites. On 4.20.16, the DO level at Site No. 26 Durfee Creek was 4.76 and at Site No. 46, tributary to Lime Cr. on Ingall Hwy., it was 4.97. On 7.18.16, DO was .79 mg/L at Site No. 46 trib. to Lime Creek and .71 mg/L at Site No. 24 Rice Lake Drain.
E. coli levels above the maximum level for partial body contact of 1,000/100mL were found as follows (in addition to the sites listed above): 7.18.16, No. 36 Shierson Drain – 8,000/100mL; and Site No. 24 Rice Lake Drain – 1,000/100mL.
Excessive nitrate levels at 10 ppm or above were found at 3 sites on 4.20.16 and 3 sites on 7.18.16. Of special concern is Site No. 36, Shierson Drain, where 50 ppm nitrate was found on both dates.
Ammonia test results at all sites exceed acceptable levels, and No. 36 Shierson Drain and No. 24 Rice Lake Drain were exceptionally high at 5 ppm.
Unfortunately, orthophosphate levels at all tested sites continue to be far too high. Orthophosphate levels range from 5 to 15 on the test strips, and when converted to Total P by multiplying by .3262, these levels range from 1.631 to 4.893. Michigan does not have water quality standards for phosphorus for non-point sources, but it is <1 mg/L (ppm) for point sources (industry, municipal wastewater treatment plants). The safe level for aquatic life is <.05 mg/L, and the danger level is .1 mg/L. So at the very least, our phosphorus levels are nearly 16 times above the danger level for aquatic life, and at the worst nearly 48 times above it.
2016: 1st Round of water sampling by ECCSCM volunteers 4/20/2016
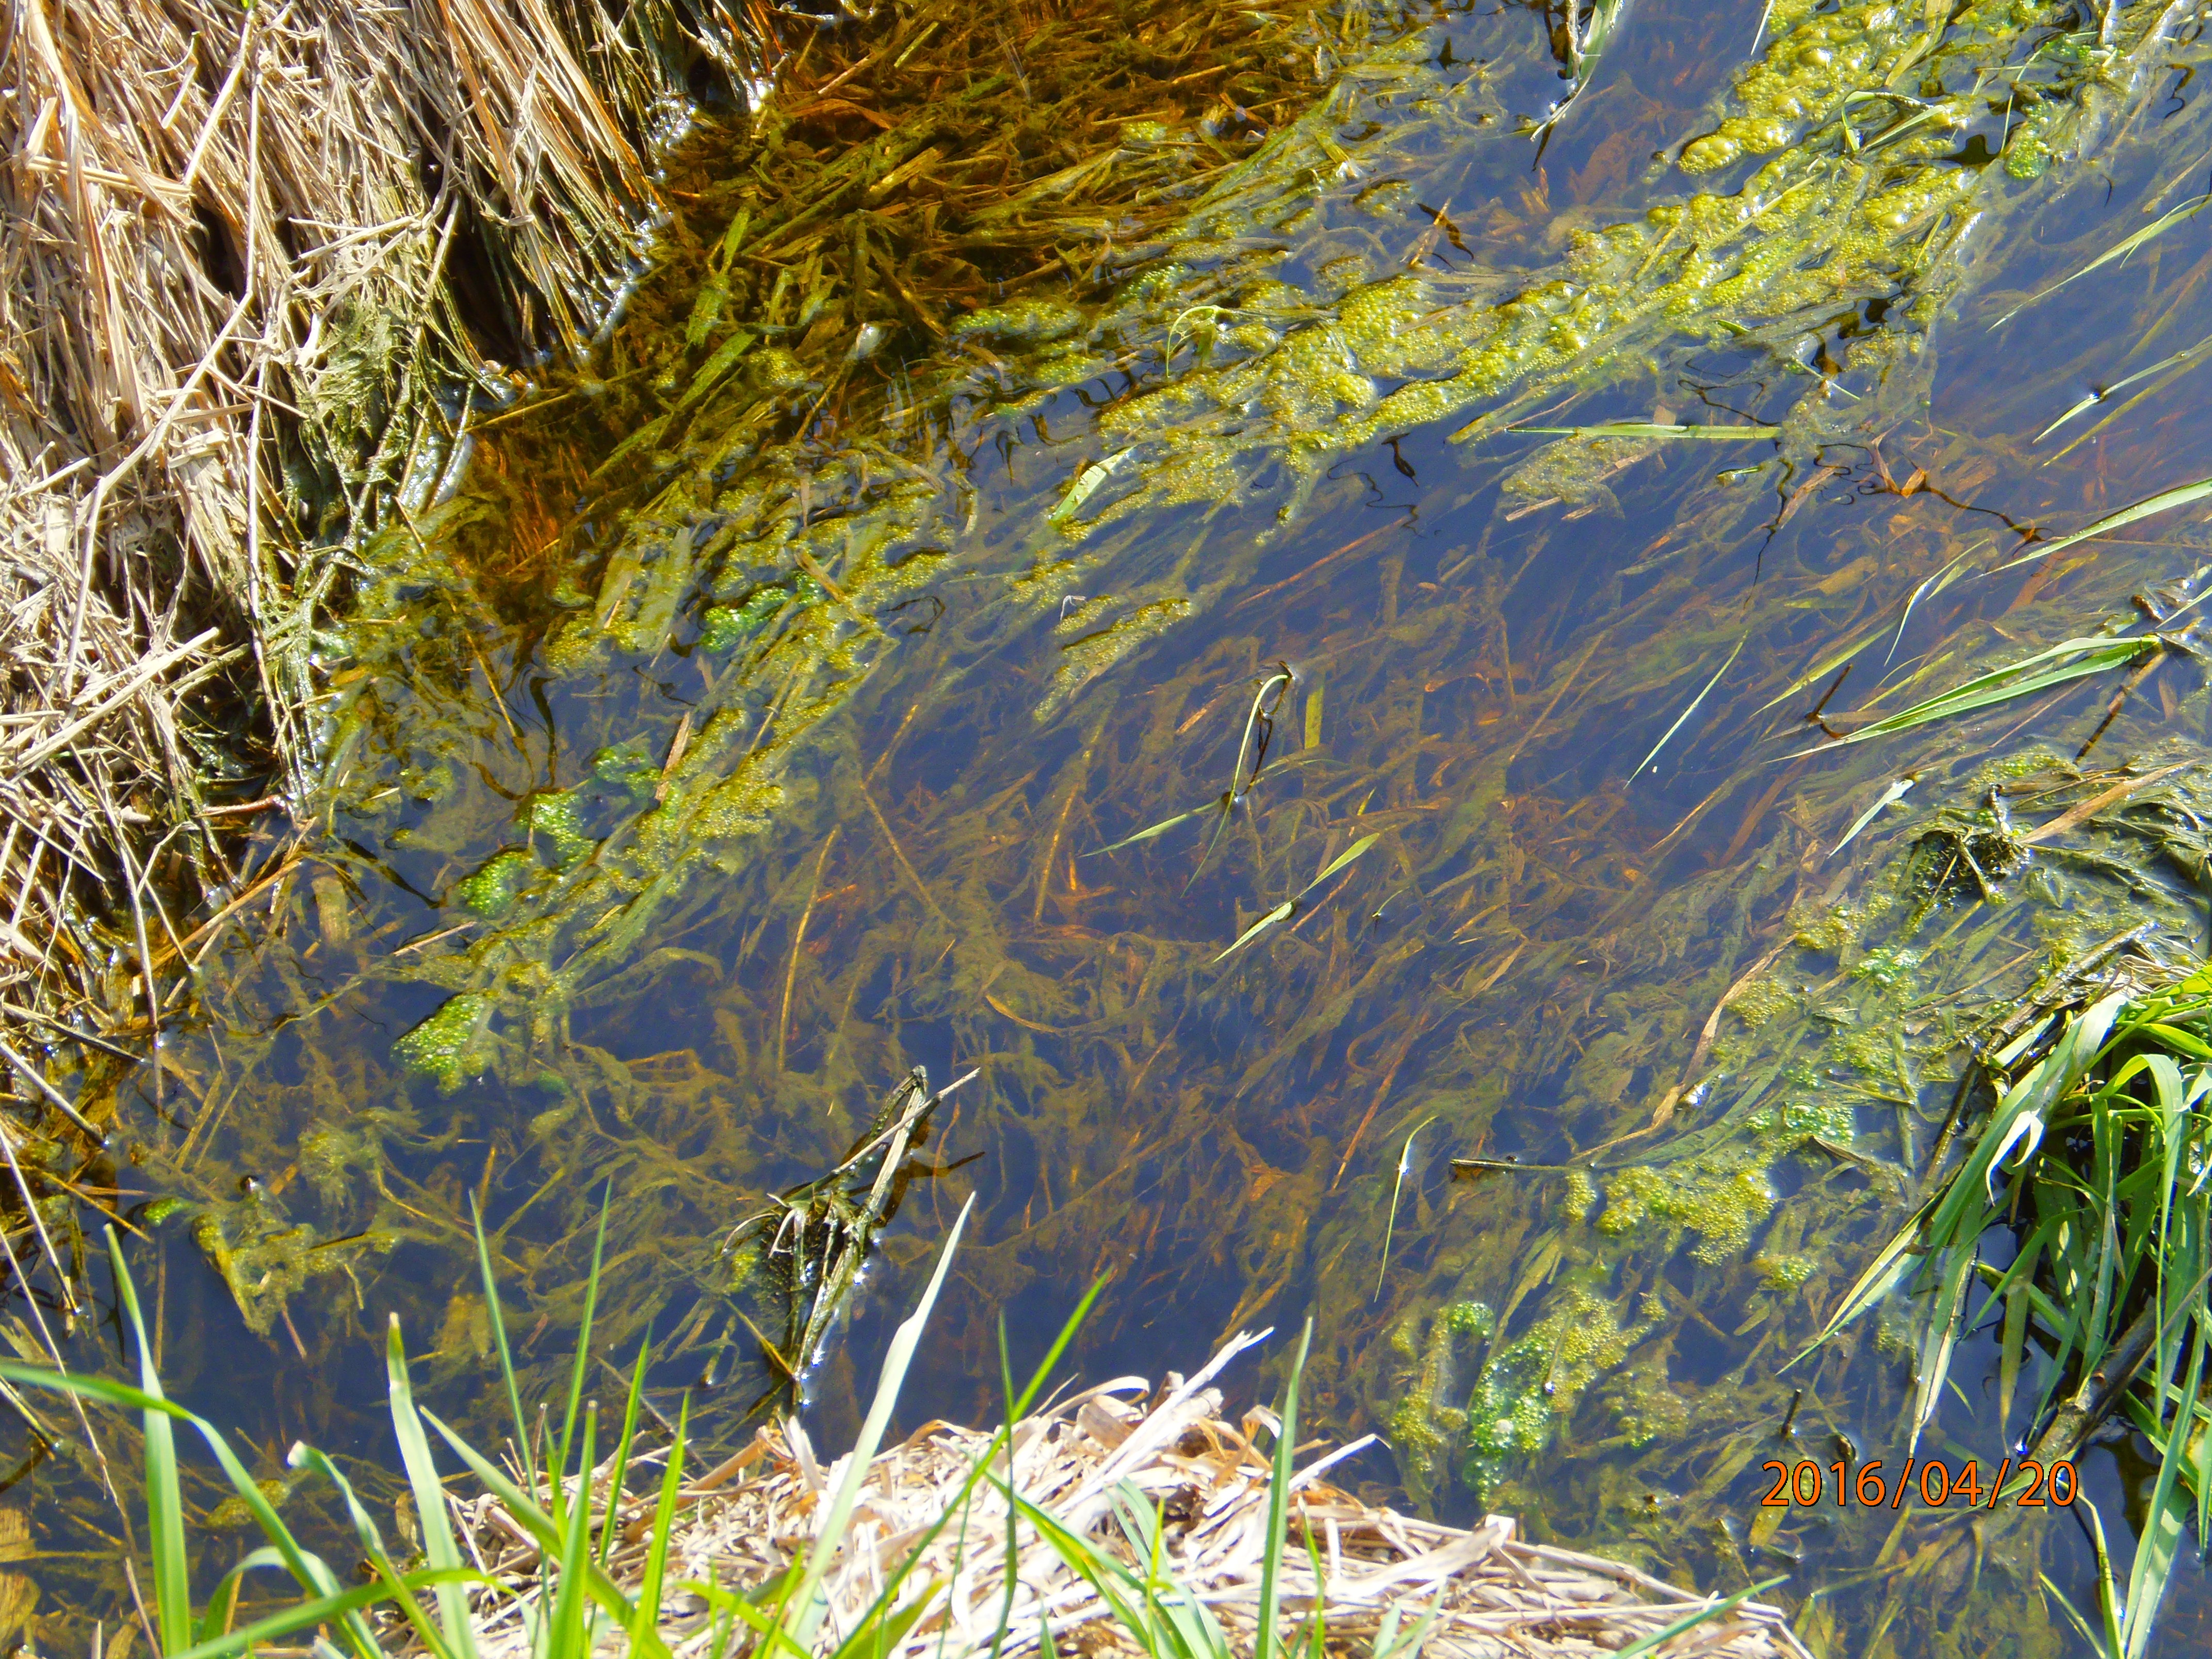
ECCSCM volunteers did their first round of water sampling on 4.20.16. Two of these sites (Durfee Cr. Extension and Shierson Drain) were also tested last year on 4.20.15, when very similar results were found. The highest E. coli readings were at Shierson Drain and the Lime Lake Inlet on Elm Rd. We found excessively high nitrate levels at 3 sites: Durfee Cr. Ext., Shierson Dr., and the tributary to Lime Creek on Ingall Hwy. Orthophosphate (PO-4) levels were again high at all sites, at levels consistent with what we find mid-spring. Ammonia was present at all sites at low levels. Of special concern was the dissolved oxygen level of 1.79 (far below the recommended level of 5.0 mg/L). (Anything below 3.0 mg/L in a warm-water stream is too low to sustain fish.) Two other sites, Durfee Cr. Ext. and the tributary to Lime Creek on Ingall, had low dissolved oxygen. In general and in natural conditions, low DO levels are seen later in the summer. We found alarming levels of algae for this time of year at several sites, and bloodworms were found at the outlet to Fisher Lake. See photos.
Durfee Cr., algae already – way too early!

Stormwater drain, flows directly from CAFO lagoon to Fisher Lake. Pink spot is bloodworms, dead bloodworm at lower right. Dissolved oxygen at 1.79 mg/L, too low to sustain fish life; unlikely that bloodworms are able to live for long with DO at that level. Bloodworms were noted again at that location on 4.21.16.

Wooded area removed, new tile installed in wetland area this location. Excessive algae for this time of year!

Water flowing in Shierson Dr., Lenawee County Drain Commission catch basin, located at the edge of a field where manure is applied. Photo shows tile outlet into drain.
2015 ECCSCM Water Monitoring Project:
ECCSCM’s 2015 Water Monitoring Project began in April, with sampling at 8 sites near 4 CAFOs. All sites are in western River Raisin or eastern Bean Cr watersheds, and all these waters flow to Lake Erie. Test results from the sampling on 4-20-15 show two sites of serious concern: Rice Lake Dr at Haley Rd, and Deline Dr Ext at Tomer Rd – both near Hoffland Dairy CAFO facility and/or manure application fields. Water samples from these 2 sites violated Michigan’s water quality standards for E. coli (5,900/100mL at Rice Lake Drain; 2,100/100mL at Deline Dr Ext); and both also tested extremely high in Nitrate, Phosphate (PO4), and Ammonia. In fact, EVERY SITE tested extremely high in Phosphate (PO4), the dissolved phosphorus implicated in the toxic algae blooms in Lake Erie. Water sampling crew on 8-12-15 found dead fish floating in Rice Lake Drain. This site has long history of pollution – see E. coli contamination data (2002-2015), as well as documentation in 2004 of the pathogen Cryptosporidium at this site by MSU and internationalCryptosporidium researcher Dr Joan Rose.
Total data through Aug 12, 2015
2015 Quality Assurance Plan


4-20-15 – Rice Lake Drain, with E. coli count of 5,900/100mL; and 8-12-15 – Dead fish floating in Rice Lake Dr.
2014 ECCSCM Water Monitoring Projects:
Hazen Creek/South Branch River Raisin Monitoring Project started in April 2014, with seasonal monitoring at six sites northwest of Adrian in Lenawee County, an intensive livestock production area. We’re testing water at 3 sites in Hazen Creek, the major tributary of the South Branch of the River Raisin; and 3 sites in the South Branch itself. We test for E. coli, Dissolved Oxygen, as well as Nitrate and Nitrite, Ammonia, and Phosphate, the nutrients that feed harmful algae blooms in Lake Erie.
The site of greatest concern so far is #18, Hazen Creek at Plank Rd, downstream from Halliwill and New Flevo CAFOs, with high E. coli counts on both 6-23-14 and 9-9-14. Also in June and September samplings, this site, and all sites, had extremely high nutrient levels.
See total data for 2014.
2014 Quality Assurance Plan

9-9-14 – Hazen Creek at Plank Rd, E. coli count of 1,100/100mL (1,400/100mL on 6-23-14).
Bean Creek Watershed Spot Monitoring Project began in May 2014 at various sites draining new (unpopulated) Milk Source CAFO facilities and manure application fields. We test for E. coli and Dissolved Oxygen. Some manure application did occur during spring 2014 as old lagoons were emptied. On May 6, some degradation of Medina Drain was visible, with water discolored and scummy, no fish visible. The highest E. coli test so far at Medina Drain was June 19, after manure/waste application June 17, and heavy rain June 18, with E. coli >2,419/100mL (sample was tested at Adrian Water Plant, using the IDEXX process, which measures no higher than 2,419/100mL).
See test results so far.


5-6-14 – Medina Drain downstream at culvert (left), and upstream (right).
2013 Water Monitoring Projects:
At-Risk Streams Monitoring (Lime Lake Inlet, Medina Drain)– Bean/Tiffin Watershed
Both Lime Lake Inlet and Medina Drain are on Michigan’s 303(d) list of impaired waters. Medina Drain was placed on the impaired list after multiple manure discharges from liquid manure field application. Both streams drain ex-Vreba-Hoff CAFO facilities and fields that were foreclosed and shut down in 2010-2011.
While Medina Drain, in particular, has shown real recovery since the shutdown (see video of minnows in Medina Dr, Sept 2013), these streams are again at risk, with new owner Milk Source LLC set to begin operation and ship in cows, beginning Spring 2014.
(See photos THEN and NOW below; and for a 2-page album of the Vreba-Hoff years, see all pollution photos of Medina Dr)
To compare total data from this 2013 water monitoring project to the project 10 years ago (2001-2003), click these links:
Medina Drain total data
Lime Lake Inlet total data
MEDINA DRAIN, INGALL HWY …. 2002-2010, with Vreba-Hoff CAFO facility & lagoons, manure application upstream:


Medina Drain, from left: green with algae, July 2002; brown scum, March 27, 2003 – E. coli 15,800/100ml; red discoloration, June 12, 2003- E. coli17,820/100ml.
And now, 2011 -2013, without CAFO or manure application:


Medina Drain 2013, from left: clear water; minnows in Medina Dr, Sept 4, 2013 (see video below); and.water sample, clear, Sept 24, 2013 (DO 8.6mg/L; E. coli 720/100ml).
Wolf Creek Water Monitoring Project – River Raisin Watershed
Download total test results here.
In 2013, ECCSCM began a water monitoring project at 7 sites in Wolf Creek and its tributaries (River Raisin Watershed) northwest of Adrian. Already on Michigan’s 303(d) list of impaired waters because of E. coli contamination, this stream is the main inlet flowing into Lake Adrian, the City of Adrian’s drinking water reservoir.
Wolf Creek and its tributaries drain the manure-application fields of 3 CAFOs as well as other livestock operations, including Warner Farms, recently expanded to almost CAFO-size. The 3 CAFOs – Halliwill, New Flevo, and Terrehaven – are the three largest CAFOs in the area. Since the shutdown in 2010-2011 of the Vreba-Hoff CAFOs near Hudson, these 3 CAFOs northwest of Adrian hold around 60% of all the CAFO dairy animals in the area.
Test results showed serious E. coli contamination at several locations, especially Fisk Cr on Teachout Rd, where water quality violated Michigan’s Water Standard for E. coli in every sample. At this site, Fisk Creek opens up from underground tile at the edge of a Warner Farms field, and is a literal headwater of the stream, of the River Raisin, and of Lake Erie. The highest E. coli results of the Monitoring Project were in Fisk Cr (11,000/100ml on Sept 16, 2013 and 4,900/100ml on June 17, 2013).
Black Creek on Wolf Creek Rd is another site of serious concern, and also Turner Drain on Tipton Hwy, which registered periodic E. coli contamination, 4,600/100ml on Nov 19, 2013, possibly the impact of manure applications upstream. These sites are downstream of several manure-application fields of Terrehaven CAFO.
Update: Nov 8, 2013- 7 Violations – DEQ cited Terrehaven CAFO, Wolf Cr Hwy near Adrian, for multiple violations, including contaminated runofffrom the feed storage and barns flowing into an undocumented “temporary holding pond,”contaminated runoff from the production area flowing “east toward an open field” and “west toward an open field, and eventually to a small pond,” clean stormwater from several buildings contaminated with production area waste. Woody vegetation was growing on the berms of the wastewater lagoon, which “can compromise the integrity of the lagoon liner by root penetration.”
(details from DEQ Violation Notice of Nov. 8, 2013. See more information on our Violations list)


8-29-13 – Terrehaven with waste heaped, seeping, and (close-up, photo taken from opposite angle) flowing into a black manure pool.
Phosphorus levels were high at all monitoring sites, but especially at Fisk Cr, Black Cr, and Turner Drain. With the toxic algae crisis in Lake Erie linked to excess phosphorus, much of it from agricultural run-off and field-tile drainage, the pressure is on to change manure and fertilizer practices in all the western Lake Erie watersheds.
The Wolf Creek Watershed project monitored for E. coli, Dissolved Oxygen, Nitrate, Nitrite, Phosphorus, Ammonia, testing quarterly at 7 sites. Read ourQuality Assurance Plan, for more details about equipment and data analysis and reporting.


From left, 3-11-13, Fisk Cr, where it opens from underground tile as headwater stream; 11-19-13 – ECCSCM Volunteer sampling at Turner Drain, Tipton Hwy, a tributary of Wolf Creek just upstream from Lake Adrian, the City of Adrian’s drinking water supply. E. coli bacteria tested that day at4900/100ml, more than 4 times the Michigan water standard for partial body contact.
2011 Water Monitoring Project (DO, E. coli)
In this follow-up to the Water Monitoring Project 10 years ago, ECCSCM re-tested some of the same sites for Dissolved Oxygen and E. coli bacteria. Some agencies tell us practices have improved, the bad actors are gone. But the Summer 2011 test results don’t support that. The E. coli bacteria count at one site on July 12 was 52,000/100ml – 52 times Michigan’s water standard of 1,000/100ml OR LESS for partial body contact.
See total data, 5 sites, beginning July 12, 2011.
2006 Dissolved Oxygen Monitoring
Does partial waste treatment improve water quality near CAFOs? Not yet. Not at all.
In 2004, Vreba-Hoff was sued by the State of Michigan after multiple and repeated manure discharges and violations. In 2005, the settlement of this suit required Vreba-Hoff to install a partial waste treatment system, separating manure liquids and solids. Solids must be composted, but the partially treated liquid is mixed with untreated, and contaminated, silage leachate and facility washwater. This contaminated liquid is then “irrigated” onto fields. This waste, as liquid as water now, has the potential to move quickly to drainage tiles and to streams. The settlement required no water monitoring downstream.
“Partial” treatment is the key — the liquid applied to fields is still contaminated with high levels of nutrients (Phosphorus, nitrates), which lowers Dissolved Oxygen in streams. Lake Erie’s new “dead zone” has recently been linked to Phosphorus runoff from livestock waste.
In January 2006, before liquid separation/irrigation began, ECCSCM sampled 6 streams that originate on and drain only Vreba-Hoff property. The winter baseline data showed no violation of Michigan’s water quality standard for DO. The DO monitoring has continued through spring and summer.
Since the spray-irrigation of fields has begun, two sites have shown immediate and serious degradation of water quality. Dissolved Oxygen levels plummeted in Medina Drain, first in April and again in June; Durfee Creek has violated Michigan Water Quality Standards for DO in every sampling since April 19, 2006. To meet water standards, DO must be 5 mg/L or higher; less than 3 mg/L deprives aquatic life of oxygen and fish can die. Durfee Creek DO levels in the last 4 samplings have been: 3.6 mg/L, 2.4 mg/L, 3.4 mg/L, and on June 8, 2006, 1.3 mg/L.
Photos show intolerable levels of Dissolved Oxygen in two streams draining Vreba-Hoff fields. Aquatic life cannot survive.


Durfee Cr (left) and Medina Dr (right), June 8, 2006. These sites are immediately downstream from travel irrigators.
See total data of the DO monitoring in progress.
Summer 2004 Mussel Survey
A survey of freshwater mussels in Bean Creek Watershed was conducted in Summer, 2004, by the Michigan Natural Features Inventory, a program of Michigan State University. Some stream stretches were rich with mussel species; sites in one stream — Silver Creek — had no live mussels at all, indicating serious degradation of water quality. See more details, photos.
2001 – 2003 Water Monitoring Project – E. coli, Dissolved Oxygen
In response to CAFO pollution in the Hudson area, residents formed Environmentally Concerned Citizens of South Central Michigan (ECCSCM).Volunteers began periodic water monitoring in the Bean Creek Watershed in the summer of 2001. In January 2002, ECCSCM received a Community Action Grant from Sierra Club for more extensive monitoring of streams and drains adjacent to CAFOs. Since then, volunteers have sampled 79 sites, more than 400 water samples. The project tests for Dissolved Oxygen, which is critical for healthy aquatic life, and for E. coli bacteria, an indicator for risks to human health.
After two years of sampling, monitoring has documented that liquid manure moves through underground field tiles and contaminates our streams. The project has shown increasingly low DO levels in several waterways, jeopardizing aquatic life. Many sampling sites downstream from CAFOs show serious bacterial contamination whenever liquid manure is applied, but especially in spring thaws and in fall after crops have been harvested and waste is applied heavily.
See Water Monitoring Project Summary page with Total Data
(also Summary letter to legislators and state agencies, Sept. 1, 2003)

Volunteers sampling a wetland adjacent to CAFO
2004 Air Monitoring
In 2004, ECCSCM began monitoring air quality adjacent to CAFOs and to fields with liquid manure application. CAFOs are major sources of air emissions that can jeopardize neighbors downwind of the facility and of manure-application fields. Aquatic ecosystems also suffer, as ammonia settles out of air into streams and lakes. ECCSCM uses a hand-held Draeger Micro-pak digital hydrogen sulfide meter.

Hydrogen sulfide meter, at 3 ppm, 1 mile from CAFO